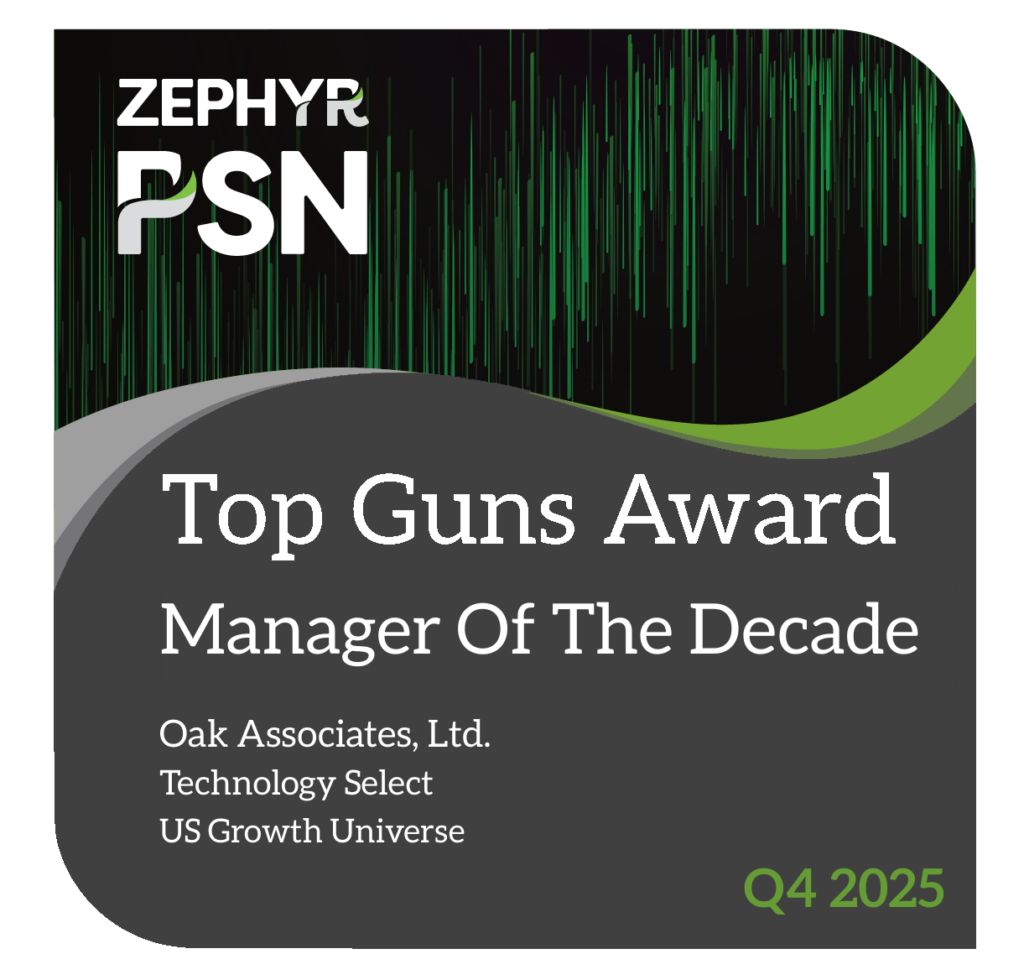
Oak Associates Named to PSN Top Guns List of Best Performing Strategies for 4Q 2025

Quarterly PSN Top Guns List published by Zephyr identifies best-in-class separate accounts, managed accounts, and managed ETF strategies.

Akron, OH—February 18, 2026— Oak Associates announced today it has been named to the celebrated PSN Top Guns List of best performing separate accounts, managed accounts, and managed ETF strategies for Q4 2025.  The highly anticipated list, published by Zephyr, remains one of the most important references for investors and asset managers.

“These managers have successfully steered through transformative events such as the COVID-19 pandemic market crash, the Brexit referendum, the US-China trade war, the global sell-off of 2015-2016, and the AI-Driven market this year”, says PSN Product Manager Nick Williams.   “Their ability to adapt to evolving market conditions, strategically position across asset classes, and capture opportunities underscores the enduring importance of active management in delivering value to investors.”   

Oak Associates Technology Select is a sector-specific strategy that seeks long-term capital growth by investing primarily in large-capitalization stocks of companies whose earnings and sales growth are driven by technology-related products and services. The investment process involves identifying the most attractive areas within technology and narrowing the search to individual stocks. The portfolio managers generally prefer market leaders with strong fundamentals that are trading at attractive valuations and have also shown a commitment to returning capital to shareholders.

“Being named a PSN Top Guns Manager of the Decade is a tremendous honor that validates our investment team’s disciplined approach. We’re proud that our long-term focus on identifying innovative market leaders and maintaining a consistent approach has delivered strong results for our clients,” said Oak Associates’ Portfolio Manager, Jeff Travis. 

Through a combination of PSN’s proprietary performance screens, the PSN Top Guns awards products in six proprietary categories in over 75 universes based on continued performance over time.

Oak Associates’ Technology Select strategy earned a PSN Top Guns Manager of the Decade award, meaning our Technology Select strategy had an r-squared of 0.80 or greater relative to the style benchmark for the latest 10-year period. Moreover, the strategy’s returns were greater than the style benchmark for the latest 10-year period and had a standard deviation less than the style benchmark for the latest ten-year period. At this point, the top ten performers for the latest 10-year period become the PSN Top Guns Manager of the Decade.

The complete list of PSN Top Guns and an overview of the methodology can be located at https://psn.fi.informais.com/PSNTopGuns/topguns_zephyr.asp

About Oak Associates

Oak Associates is an investment management firm located in Akron, Ohio. Founded in 1985, Oak has spent decades focused on U.S equities and uncovering quality growth companies that can rise above market expectations. At Oak, we believe that sustainable long-term growth for investors is best achieved through a concentrated focus on companies and sectors. Our high-conviction stock selection process centers on identifying multiple drivers of growth and engaging in fundamental research to uncover the right businesses within the right sectors. We then take meaningful positions—targeting unrealized value and seeking long-term capital appreciation independent of typical index results. We offer two key ways to invest with us, including mutual fund accounts and direct separate accounts for institutions and high net worth individuals.

About PSN

For more than four decades, PSN has been a top resource for investment professionals. Asset managers rely on Zephyr’s PSN to effectively reach institutional and retail investors. Over 2,800 firms, 285 universes, and more than 21,000 products comprise the PSN SMA database showing asset breakdowns, compliance, key personnel, ownership diversity, ESG, business objectives and strategy, style, fees, GIC sectors, fixed income ranges and full holdings. Unique to PSN is its robust historical database of over 40 Years of Data Including Net and Gross-of-Fee Returns. Zephyr’s PSN produces the PSN Outlook eBook series provides insight and trends about the SMA industry. You can view them online here.

Visit PSN online to learn more.

No compensation was directly or indirectly provided by the Adviser in connection with this rating and/or award.


More News & Insights

Read More

Why Managed Concentration in a Concentrated Market Matters for Technology Investment Portfolios

Read More
Read More

2025 Year End Market Commentary & 2026 Outlook

Read More
Read More

Seeing Through The Trees

Read More

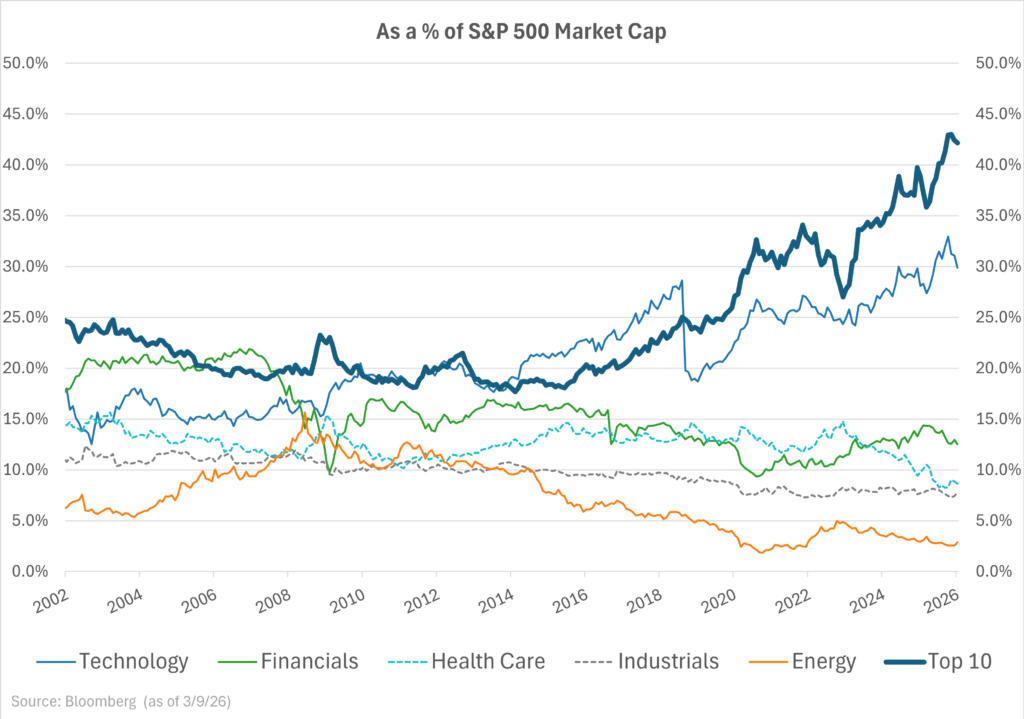
In recent years, equity markets have undergone significant changes, marked by rising market concentration, particularly within large-cap U.S. technology stocks. Almost 35% of the U.S. stock market’s current value is concentrated in companies known as the “Magnificent 7” (Alphabet, Amazon, Apple, Meta, Microsoft, Nvidia, Tesla), with the performance of these companies accounting for 42% of total market returns in 20251 and momentum a key element of the Magnificent 7 tech stocks driving outsized returns since 2022. Indeed, U.S. stock market concentration in 2025 surpassed its previous peak of 1932.2 As also seen in the Market Cap graph illustration of the top 10 holdings of the S&P 500, this elevated concentration introduces unexpected risks for investments that passively mirror a benchmark.

When a disproportionate share of market performance and investor capital is tied to a handful of dominant stocks, portfolio vulnerability increases within passive investment structures not designed for higher concentration holdings. Shifts in market sentiment, regulatory changes or unexpected disruptions affecting these leading firms can trigger outsized volatility and losses across passive portfolios that mirror headline indices. While passive investing has gained popularity, the case for active management is stronger than ever.

In a fast-evolving technology sector where there are good reasons to hold certain dominant stocks, actively managed concentration offers significant advantages. Here’s an overview of those advantages and why the actively managed concentration approach of the Red Oak Technology Select Fund portfolio management team has proven especially effective.

Deep Fundamental Research and Enhanced Focus. Technology companies often have complex, rapidly changing business models. An active manager can perform deep, fundamental research to differentiate between companies with true, sustainable competitive advantages and those that are purely speculative. For the Red Oak Technology Select Fund, we rely on intense, specialized analysis to identify attractively valued, high-growth technology companies with business models featuring high barriers to entry that passive strategies might dilute.

Reducing Risk through Stock Selection. In the technology sector, returns are not evenly distributed, with sub-sectors often featuring “winner take all” dynamics. Further, technology stocks often trade at high valuations, making stock selection essential to identifying firms with genuine, long-term earnings potential. A concentrated portfolio allows active managers to avoid overexposure to hype-driven bubbles, overweight “winner” companies and exploit high performance dispersion. While holding fewer stocks might seem riskier, managed concentration mitigates overall portfolio volatility by selecting companies with strong fundamentals and low correlation to one another. The Red Oak Technology Select Fund employs a “financials-first” stock screening process, seeking valuation discipline, quality leadership, profitability, pricing power and stability.

Quality Over Quantity. Active managers can conduct deep research to find technology companies with sustainable competitive advantages and strong fundamentals, including healthy earnings, high free cash flow yield, high return on invested capital and low sales variability, in a sector prone to disruption. While concentration is often perceived as risky, active, disciplined management of a few high-quality companies can help reduce risk. When markets are heavily concentrated, passive strategies may inadvertently expose investors to unexpected risks should market leadership rotate or if those few dominant stocks underperform. The Red Oak Technology Select Fund normally holds 20-30 securities in 5-8 technology sub-sectors and employs a sell discipline as key to its performance as its selection criteria.


Real-Time, Tailored Adaptability and Agility. The technology sector is volatile, experiencing rapid shifts in innovation cycles, themes and company leadership. Active managers can identify turning points and quickly adapt to emerging trends, strategically allocating capital toward specific high potential “new economy” segments. Intentionally designing selective concentration exposure, the Red Oak Technology Select Fund’s representative themes include enterprise capital technology spending, digital media advertising, semiconductor proliferation, electronic finance and cybersecurity.

From an individual stock perspective, managed concentration enables mitigation of “winner’s curse,” managed risk during sector pullbacks and reduction in the crowding that has become typical, as reflected in the high top-end concentration of some major passive, market-weighted indices. Active managers can adjust weightings—add to positions as valuations and long-term prospects become attractive, take off gains, exploit market inefficiencies, reduce exposure to or completely exit overvalued or overweighted stocks and dynamically and purposefully re-balance positions without regard to raw market forces—providing a defensive advantage that index tracking funds cannot. While the Red Oak Technology Select Fund typically holds positions in some, but not all, of the Magnificent 7 stocks, our managed portfolio offers daily oversight and the ability to pivot rapidly at market inflection points in response to market pullbacks or shifting trends and allocate away from incumbent, disrupted firms to new leaders, particularly useful for navigating the fast-paced, high-beta technology sector.

Higher Potential Alpha Generation. At Oak Associates, we believe that a concentrated portfolio of financials-first technology sector “best ideas” leads to higher potential Alpha generation. For the latest holdings, attribution and performance of the Red Oak Technology Select Fund, please visit https://www.oakfunds.com/strategies/red-oak-technology-select/.

1 “U.S. Equities, December 2025,” S&P Dow Jones Indices Market Attributes.

2”Stock Market Concentration Has Surpassed Its 1930s Peak. Should Investors Worry?,” Morningstar, February 27,2026. As a % of S&P 500 Market Cap graph data source: Bloomberg as of 3/9/2026.

Past performance is no guarantee of future results. Oak Associates Funds are available to U.S. investors only. The thoughts and opinions expressed in the article are solely those of the author as of March 11, 2026. The referenced indices are for illustrative general market comparisons only and not meant to represent performance of any fund. Investors cannot invest directly in an index.


Alpha–the excess return of an investment relative a benchmark index, when adjusted for risk.


For a complete list of Red Oak Technology Select Fund holdings, please visit the Forms & Information page of our website: https://www.oakfunds.com/forms-information/

To determine if the Oak Associates Funds are an appropriate investment for you, carefully consider each Fund’s investment objectives, risk factors and charges and expenses before investing. This and other information can be found in the Funds’ prospectus, which may be obtained from your investment representative or by calling 888.462.5386. Please read it carefully before you invest or send money.

Mutual fund investing involves risk, including the possible loss of principal. Oak Associates Funds are distributed by Ultimus Fund Distributors, LLC (Member FINRA). Ultimus Fund Distributors, LLC and Oak Associates Funds are separate and unaffiliated.                           

20260311-5292906


More News & Insights

Read More

2025 Year End Market Commentary & 2026 Outlook

Read More
Read More

Seeing Through The Trees

Read More
Read More

Health Care Sector Clouds May Be Clearing

Read More

Prior to the U.S.–Israeli attack on Iran, we expected U.S. equities to profit from a steady stream of economic stimulus and greater clarity around tariff policy. Consumers were likely to benefit from above-average tax refunds this season, while businesses stood to take advantage of accelerated depreciation rules and incentives to expand U.S.-based manufacturing. The pending change in leadership at the Federal Reserve could also have resulted in more administration-aligned, less restrictive interest rate policies.

This backdrop, combined with improved clarity regarding which countries and industries would face tariffs, and at what rates, should have provided a meaningful tailwind for U.S. equities. The stock market dislikes uncertainty and has consistently rallied on news that tariffs were lower than anticipated, delayed, or ruled unlawful. Settling the tariff question may have been welcomed by investors and businesses alike, as long-term strategic planning is difficult when import prices and cost structures change through executive action.

With the U.S. and Israel now engaged in a new geopolitical conflict in the Middle East, many of these tailwinds are being eroded by higher fuel prices, weakening sentiment, and rising inflationary pressures.

Revised 2026 Outlook

Historically, sharp spikes in energy prices have been a catalyst that pushed the U.S. economy into recession. While the U.S. economic base is resilient and diversified, energy prices have a uniquely broad influence, driving up input costs and squeezing consumers. A sustained surge in oil prices is therefore a very concerning development.

A short-term spike can be absorbed, but if energy prices remain elevated for a prolonged period, recession risk rises substantially. Consumers, who are highly sensitive to gasoline prices, will retrench, further slowing the economy. The duration of this conflict and the persistence of higher energy prices will be critical, even if the conflict ends quickly.

Oil Is Not the Only Problem

U.S. equities had been anticipating further easing of the tight monetary conditions imposed by the Fed to combat inflation following the COVID-19 pandemic in 2022. The Fed began an interest rate reduction cycle in September 2024 but has occasionally delayed additional cuts in order to assess the impact tariffs had on price levels. The Fed’s focus may now shift from a slowing job market and tariff-related inflation to energy-driven inflation. Instead of anticipating rate cuts, the market is now facing the possibility that the Fed may need an extended pause, or even raise rates, rather than continue lowering them.

This shift from potentially lower rates to rate increases is important because it affects company valuations, as future earnings are discounted using prevailing interest rate expectations.  Rising rates can also alter investor risk appetite, making high valuations less attractive. This relationship underscores the 7% correction in the S&P 500 since the Iranian conflict began.

The Bond Market May Be the Ultimate Arbiter of Fiscal and Monetary Policy

The yield on the 2-year Treasury is often a good representation of where market participants believe the Fed should set short-term interest rates. Historically, the 2-year yield has tended to anticipate the direction of future Fed policy.

Following the COVID pandemic, the 2-year yield indicated that the Fed was behind the curve and needed to raise rates to fight inflation. Conversely, over the past two years, the yield suggested the Fed could lower rates. Following the attack on Iran however, the market’s consensus appears to have shifted again. The 2-year yield now exceeds the Fed Funds rate, implying the market anticipates the Fed may tighten policy to confront renewed inflation.

26Q1_picture1

Higher Interest Expense Is Restrictive

As equity investors, we naturally prefer stocks to fixed income securities, especially when inflationary pressures are elevated. However, the bond market is showing signs of stress that are likely to affect both the housing market and the broader economy. The yield on 10-year Treasuries, which strongly influences mortgage rates, has risen sharply in March. Mortgage rates have increased 50 basis points since the Iran conflict began, adding further stress to the housing market and reducing the economic stimulus typically provided by a strong real estate sector.

26Q1_picture2

Overall demand for U.S. Treasuries has remained solid, but the mix of buyers suggests growing international concern about the U.S. fiscal situation. While both political parties spend heavily, they have very different approaches to increasing government revenue. Congress was determined to extend tax cuts, but receipts from tariffs anticipated to replace lost revenue are unlikely to be sufficient to offset the cost that the tax cuts may add to the deficit. Supply chains are already shifting to avoid import duties, and the legality of some tariffs (or refunds) remains unclear.

Questions about how the government will now pay for the tax breaks, while also spending a media-reported $1 billion per day on the Iran war, are certainly a concern for fiscal hawks. U.S. interest expense is already at record levels, with approximately 19% of tax receipts now going toward servicing outstanding debt, nearly double the level of five years ago. This situation puts upward pressure on bond yields and downward pressure on the U.S. dollar.

What We Are Doing to Manage Market Uncertainty

To navigate the change in the investment environment, particularly if energy prices remain elevated, we have been broadening sector exposure and trimming long-term winners with extended valuations. During periods of uncertainty, we tend to tilt further toward quality metrics and companies with durable earnings.

It is extremely difficult to predict whether this conflict will escalate or de-escalate quickly. Therefore, we believe it is prudent to remain invested in high-quality businesses with attractive long-term opportunities, while recognizing that initial oil and commodity supply disruptions may have lingering effects on the global economy. Stock prices have already recovered, somewhat reflecting the change in the economic risk profile. Given that the United States is fairly energy independent, the supply turmoil caused by a closure in the Straits of Hormuz would be more detrimental to Asian and European economies.

Stocks and Wars

Historically, U.S. equities have tended to tolerate military conflicts relatively well. For example, during the buildup to and initial invasion of Ukraine in 2022, the S&P 500 fell approximately 15% in the first half of 2022 but recovered quickly. It then went on to rise more than 90% over the following 3.5 years.

The Second Gulf War following the 9/11 attacks is more difficult to evaluate because it occurred amidst the dot-com bubble collapse and deep bear market. In this case, the market’s performance was influenced more by the economic cycle than by the conflict itself, which then persisted for more than 20 years in varying intensity.

During the First Gulf War in 1990, the S&P 500 fell roughly 16% in the first month of the war but recovered most losses by year-end and rose approximately 30% in 1991. Notably, that conflict was relatively short, something we hope proves true in this instance as well.

Conclusions

The outlook for 2026 has changed due to rising energy prices and the shift in investor expectations regarding Federal Reserve policy. The S&P 500 correction in March reflects this change in outlook and is consistent with declines seen at the onset of previous military conflicts. Many positives remain for U.S. stocks; specifically, the AI buildout continues, innovation and productivity remain strong, and stimulus from depreciation incentives and tax rebates is supportive. Historically, markets tend to look beyond military conflicts, and secular economic trends ultimately prevail.

While geopolitical conflicts create uncertainty and short-term volatility, history suggests markets ultimately follow earnings, interest rates, and economic growth. The key variable today is global energy prices. If oil prices retreat, this may prove to be a temporary correction. If energy prices remain elevated for an extended period, recession risks rise. Until that becomes clearer, we believe a higher-quality, more defensive posture is warranted while remaining fully invested for long-term growth. Our base case remains that the conflict is brief and supply disruptions are moderate. We acknowledge that risk aversion is rising, and we believe it is prudent to protect profits and emphasize more defensive portfolio characteristics. We believe stocks remain preferable to bonds, and the U.S. economy is less exposed to energy risks than other international markets.

As always, we are available to answer client questions and look forward to speaking with clients, advisors, and consultants. Please feel free to reach out at any time.

Kind Regards,

Robert Stimpson, CFA
Chief Investment Officer
Oak Associates, ltd.

Grow stronger together.


The investments referenced in this article may or may not align with those currently recommended or held by Oak Associates for itself, its associated persons, or on behalf of clients within the firm’s strategies as of the date indicated. These investments are subject to change. The mentioned investments do not necessarily represent all those bought, sold, or recommended to advisory clients over the past twelve months. Portfolios in other Oak Associates strategies may contain the same or different investments, due to factors such as varying investment strategies, client-specific restrictions, mandates, substitutions, liquidity requirements, or legacy holdings, among others. The investments highlighted were not selected based on their past performance. Readers should not assume these investments have been or will be profitable in the future.

Past performance is not a reliable indicator of future results. Investments can lose value, and there is no guarantee that any strategy or product will achieve its objectives or perform as anticipated. All investments involve risk, including the potential loss of principal. Before making any investment decisions, individuals should assess their risk tolerance and seek advice from a financial advisor. Information that is sourced from a third-party is assumed to be accurate but is not guarantee. This commentary does not constitute an offer or solicitation to buy or sell any financial products.

The S&P 500 Index is a well-known, market-capitalization-weighted index of 500 widely held U.S. equities, designed to reflect broad U.S. stock market performance.


CFA is a registered trademark of the CFA Institute.


More News & Insights

Read More

Why Managed Concentration in a Concentrated Market Matters for Technology Investment Portfolios

Read More
Read More

2025 Capital Gains & Dividend Distributions

Read More
Read More

Seeing Through The Trees

Read More
Read more: 2026 First Quarter Market Commentary

U.S. equities produced strong returns in 2025 despite faltering employment data and tariff-driven volatility. The S&P 500 Index rose 17.8% in 2025, its third straight year of double-digit gains and well above the 12% average annual return over the past 30 years. The market’s success was driven by an improving underlying investment environment as the Federal Reserve pivoted away from restrictive policies designed to prevent inflation. All else equal, equities historically perform well in a moderate growth, low interest-rate environment. Despite persistent inflation concerns, faltering employment, and volatile import/export trends, investors welcomed the Federal Reserve’s actions to lower interest rates and unwind the tight monetary environment. Prospects of continued strong artificial intelligence (AI) infrastructure investment and optimism surrounding lower regulation may also have helped propel U.S. stocks to record highs.

In retrospect, the success of U.S. equities in 2025 appears reasonable. Mega-cap technology companies—uniquely positioned to both fund the massive capital spending requirements of AI and capitalize on its proliferation—led the stock market higher. This group dominates market-capitalization-weighted index performance due to its outsized membership. Telecommunication companies, normally considered a more defensive sector, also thrived from the AI data-center buildout, while certain industrials benefited from increased demand for communications equipment, wire, and components. On the weaker side of the market, consumer stocks (both discretionary and staples) underperformed, as concerns over tariff-induced inflation and layoffs hampered the sectors. Energy stocks also lagged as global economic activity slowed amid tariff uncertainty and as governments worked to keep oil prices contained to mitigate inflationary pressures.

Admittedly, the market was far stronger in 2025 than we expected. We would argue that the delayed implementation of broad tariffs allowed the market to rally on the prospects of lower interest rates and a more accommodative Federal Reserve. Chairman Powell’s term ends in May 2026, and President Trump is likely to appoint a new Chair more aligned with his economic priorities. Wall Street speculates this transition could result in lower short-term lending rates, a potential return to quantitative easing, and job-market stimulus—contrasting with the Fed’s more recent emphasis on inflation containment.

The affordability crisis is real, particularly in food prices and certain regional housing markets. However, we anticipate headline inflation could remain relatively soft. The two most significant components of the Consumer Price Index, the most widely followed inflation gauge, remain shelter and energy. Housing-related inflation is a slow-moving component due to the annual resetting of rental rates, implying that downward pressure from shelter inflation may persist as mortgage rates decline and rents reset. Energy prices are also under pressure, as policy measures and diplomatic engagement appear to have convinced both domestic and international suppliers to maintain abundant supply. Therefore, despite rising food and services costs and tariff-impacted goods, the October headline CPI reading of 2.7% is not overly concerning. This has allowed the Fed to pivot away from its inflation-first posture, though a leadership change could accelerate more stimulative open-market operations (for better or worse).

While broad and aggressive tariffs were sidelined for much of 2025, they are likely to return and contribute to renewed volatility in 2026. Thus far, it appears unlikely that the Trump administration will yield to market pressure (or court rulings) to gracefully abandon sweeping tariffs. Instead, several legislative avenues remain options for the President to reimpose country-specific and industry-focused tariffs, though with congressional approval, to pursue broader policy goals. Whether Congress will ultimately support broad tariff reimplementation remains uncertain, but tariff-induced volatility could reemerge in 2026.

Massive capital investment in artificial intelligence was a key driver of U.S. equity strength and economic activity in 2025. Major technology companies are investing trillions in aggregate over the next decade into AI data centers, power generation, and semiconductor capacity. With an AI arms race clearly underway, specialized chip manufacturers were among the strongest performers of the year. Unlike the dot-com capital-spending cycle of the late 1990s, this investment phase occurs at a time when technology leaders are among the most profitable and financially robust companies in the market. They are best positioned to fund these investments and withstand the extended timeline required to generate returns. As we move into 2026, concerns about an AI bubble will persist and warrant monitoring, but for now the capital-spending cycle remains intact.

While the U.S. market performed well in 2025, it underperformed many international markets. Major Asian equity markets rose more than 30%, Europe’s Euro Stoxx 50 Index gained 22%, and the Bloomberg Latin America Index surged 55%. Weakness in the U.S. dollar—driven by tariff and trade uncertainty—partly explains this outperformance. However, there also appears to be a gradual reallocation away from U.S. assets amid geopolitical realignment under the Trump Administration. U.S. fiscal and monetary instability fueled interest in physical gold and other precious metals. Spot gold prices rose more than 65% in 2025, while silver surged 147%. Although country-specific data is slow, there are reports that some global central banks have increased gold reserves while reducing exposure to U.S. dollars and U.S.-denominated assets.

Looking ahead to 2026, we expect many current trends to continue. AI investment and technology leadership may persist, lower interest rates should support financial and real-estate stocks, and tariff policy issues are likely to resurface. However, unexpected developments are often what derail Wall Street. Geopolitical risk remains elevated, including the potential escalation of conflict involving Russia or tensions in Asia. U.S. intervention in Venezuela is likely to be economically inconsequential for U.S. equities, similar to the market impact following Russia’s invasion of Ukraine. Energy stocks have the most to gain from the recent intervention, but it is too early to truly assess. That said, if such actions embolden other nations to intervene in sovereign states, it could threaten the Bretton Woods–based global economic order that has existed since World War II. A breakdown in this framework could raise global risk premiums and increase market volatility.

The outlook for the U.S. job market remains the most important indicator to monitor in 2026. A more accommodative Federal Reserve and improved tariff clarity could support employment but also risk reigniting inflation. As 2025 ends, uncertainty has fostered a “no-fire, no-hire” environment. Layoffs throughout the year reached levels typically associated with recessionary conditions. To what extent these layoffs resulted from federal government restructuring under DOGE initiatives versus post-pandemic over-hiring remain unclear. Nevertheless, further deterioration in employment data would meaningfully increase recession risks and investor concern and therefore warrants close attention.

In conclusion, the underlying investment environment remains the primary concern for U.S. investors. For now, a low-interest-rate, slow-growth, and relatively low-inflation backdrop appears likely to persist, supporting equity markets. Inflation risks and geopolitical instability remain key areas to monitor. While valuation multiples expanded in 2025, margins also rose record levels and the profitability of large-cap U.S. companies appears resilient. With both valuations and risks elevated, we expect to tilt portfolios toward companies exhibiting earnings stability and strong capital-return characteristics. As bull markets mature, factors such as return on invested capital, dividend yield, and free cash-flow yield historically offer more attractive risk-adjusted returns.

Thanks for investing with Oak Associates.

Kind Regards,

Robert Stimpson, CFA
Chief Investment Officer
Oak Associates, ltd.

Grow stronger together.


The investments referenced in this article may or may not align with those currently recommended or held by Oak Associates for itself, its associated persons, or on behalf of clients within the firm’s strategies as of the date indicated. These investments are subject to change. The mentioned investments do not necessarily represent all those bought, sold, or recommended to advisory clients over the past twelve months. Portfolios in other Oak Associates strategies may contain the same or different investments, due to factors such as varying investment strategies, client-specific restrictions, mandates, substitutions, liquidity requirements, or legacy holdings, among others. The investments highlighted were not selected based on their past performance. Readers should not assume these investments have been or will be profitable in the future.

Past performance is not a reliable indicator of future results. Investments can lose value, and there is no guarantee that any strategy or product will achieve its objectives or perform as anticipated. All investments involve risk, including the potential loss of principal. Before making any investment decisions, individuals should assess their risk tolerance and seek advice from a financial advisor. Information that is sourced from a third-party is assumed to be accurate but is not guarantee. This commentary does not constitute an offer or solicitation to buy or sell any financial products.

The S&P 500 Index is a well-known, market-capitalization-weighted index of 500 widely held U.S. equities, designed to reflect broad U.S. stock market performance.


CFA is a registered trademark of the CFA Institute.


More News & Insights

Read More

2025 Capital Gains & Dividend Distributions

Read More
Read More

Seeing Through The Trees

Read More
Read More

Health Care Sector Clouds May Be Clearing

Read More
Read more: 2025 Year End Market Commentary & 2026 Outlook

Clearing emotion to stay on track with the long-term investment goal.

We are all emotional beings and investing takes us through an unnatural journey of psychological twists and turns. We set aside investment capital for that journey of delayed gratification to reach a desired long-term goal (future reward).

Along the way, we experience a number of natural emotions that can lead to counterproductive actions in our pursuit of that desired outcome, such as: a heightened sensitivity to short-term losses over big picture gains, seeking reassurance by waiting for a positive move before investing, the belief that we can increase performance by timing the market, and the fear of missing out on a running investment trend. These are natural emotions that generally lead to poorly timed investment decisions. However, there are ways we can mitigate such emotions, the trees blocking our view to the long-term investment goal.

The Financial Advisor Effect

A financial advisor can be a key sounding board providing guidance and setting up a long-term financial plan.  An advisor is there to bring an understanding of behavioral finance and to help mitigate potential counterproductive, emotion-driven decisions.  Advisors assist with maintaining a long-term perspective and an objective eye on diversification, while also coordinating properly timed rebalancing efforts.  When working with a financial advisor, you have someone who knows your full family picture including all accounts, insurances, retirement goals and inheritance plans.  They can also assist you with strategic tax loss harvesting and determine which investment accounts to trade to optimize when gains/losses should be realized or instead pushed into later years.  The financial advisor can help avoid a potential panic sale where an investor is looking at one aspect of their portfolio but where that advisor may have built in other investments that counteract or diversify away some of that risk.  Along the way, the advisor can ease an emotional reaction to a loss by explaining where it may end up being a benefit in unexpected ways, such as at tax time or as part of a coordinated strategic shift.

At Oak Associates Funds, we recognize the important role played by our network of financial advisor partners and have built our dual-concentrated, fully invested equity growth investment process to also fit within broader customized investment plans.  By staying fully invested in our portfolios, we allow the excess short-term cash decisions to be made at the financial advisor/client level, since each client has unique needs and variable investment path timing.  This helps make allocation planning more deliberate and transparent.

Use Time to Your Advantage and Stay Invested

The value of an investment is a culmination of three variables: amount invested, time invested and rate of return.  We have the most control over the first two in achieving the optimal benefits of compounding.  Investing early and staying invested has been a hallmark of building wealth through compounding interest.  The urge to time markets, where timing decisions must be correct twice, or to chase winners, where often a decisive move has already been missed, most often leads to less optimal outcomes versus simply sticking to a well-planned long-term allocation.  We are reminded again of the risk that comes with timing the market by the latest DALBAR Quantitative Analysis of Investor Behavior report release, indicating: “Despite strong performance in the equity markets, investors continued to underperform due to their behavior.  Withdrawals from equity funds occurred in every quarter of 2024, with the largest outflows taking place just before a major surge.”1   The potential impact of a poor market-timing decision is further illustrated in the graph showing how just missing a few of the best days, using the S&P 500 Index© as an example, could have a long-term impact on an investment.  

Don’t Underestimate the Power of Automatic Investment Plans

It is not always possible to front-load your investment and that’s where an automatic investment plan and the related dollar-cost averaging effect should not be underestimated.  An automatic investment plan can be an effective investment tool in maintaining a disciplined investment process, while also potentially limiting emotional decisions.  Knowing that a fixed dollar amount will automatically be invested on a scheduled basis can minimize our temptation to jump in and out of the market.  In essence, why would I make an emotional sale when I’m scheduled to buy more of it right back?  I can set an amount on a fixed schedule and let the dollar-cost averaging impact help smooth out market fluctuations over time, taking advantage of the fact that more shares are bought during times of lower prices than at times of higher prices.   This can lower the average cost per share and help to quell the fear of buying at the wrong time (failure to launch while waiting for an unknowable perfect time to buy), or the emotional tendency to sell low (during market turmoil), or fear-of-missing-out urge to buy high (during market exuberance).  Finally, for those investors that knowingly just wish to be more individually active within the markets, setting an automatic investment plan at the core of an allocation may at least partially lessen the overall potential impact by limiting such movements to smaller amounts at the margin.

At Oak Associates, we believe that sustainable long-term growth for investors is best achieved through a concentrated focus on companies and sectors.  Accordingly, we maintain this Dual-Concentrated Investment Approach when managing the Oak Associates Funds.  I hope you find value in these thoughts and thank you for your time.

1 “Investors Missed the Best of 2024’s Market Gains, Latest DALBAR Investor Behavior Report Finds”, Dalbar, March 31, 2025.

Past performance is no guarantee of future results. Oak Associates Funds are available to U.S. investors only. The thoughts and opinions expressed in the article are solely those of the author as of October 15, 2025. The referenced indices are for illustrative general market comparisons only and not meant to represent performance of any fund. Investors cannot invest directly in an index.   

To determine if the Oak Associates Funds are an appropriate investment for you, carefully consider each Fund’s investment objectives, risk factors and charges and expenses before investing. This and other information can be found in the Funds’ prospectus, which may be obtained from your investment representative or by calling 888.462.5386. Please read it carefully before you invest or send money.

Mutual fund investing involves risk, including the possible loss of principal. Oak Associates Funds are distributed by Ultimus Fund Distributors, LLC (Member FINRA). Ultimus Fund Distributors, LLC and Oak Associates Funds are separate and unaffiliated.                           

20251106-4962749


More News & Insights

For the 30 years from 1989 to 2019, U.S. health care sector returns closely tracked those of the technology sector—and with notably less volatility.1 But, since then, the sector has produced lackluster results for investors. The current U.S. Administration’s desire to force U.S. drug prices to align with the lowest international reference price, impose tariffs on imported pharmaceuticals unless plants are built in the U.S., cut NIH/CDC funding, slash Medicaid spending, battle over publicly-funded scientific research and ACA subsidies, and support controversial Health and Human Services leadership—along with competition from China and impending large-cap pharma patent/revenue cliffs—has created considerable short-term uncertainty. Despite these near-term headwinds, largely already priced in, we believe the clouds may be clearing for the health care sector. Here’s why.

A Defensive Sector. The health care sector, which comprises about 9% of the total S&P 500® Index as of September 30, 2025, is considered defensive, resilient and comparatively stable because demand for its products and services is not highly correlated with the overall stock market or the broader economy. People require health care regardless of economic conditions. Also, historically, the health care sector has seen lower drawdowns when market stress has been high.2 As slower economic growth is considered likely for 2026 as is heightened market volatility, the health care sector may be poised to outperform.

Compelling Underlying Fundamentals. The health care sector has historically demonstrated stable, consistent earnings growth—even when the broad market falters, with lower volatility. A track record of growing earnings faster than inflation also provides investors with a valuable hedge amid what many believe will be an environment of continued above average inflation. Currently, following a multi-year period of sluggish performance, the sector is offering attractive valuations, trading at a significant discount to the broader market.

-The health care sector is trading near historic lows globally, and in the U.S., is now trading at the deepest discount to the broader market in nearly 40 years based on relative forward price/earnings (p/e) multiples.2 The 12-month forward p/e ratio of U.S. health care was 17.3% as of September 30, 2025 versus 22.8% for  the broad S&P 500 Index.3

-Even as technology stocks dominated headlines, health care was the only sector that grew earnings steadily for more than 20 years, including throughout the pandemic.4 And even with a downward revision in earnings estimates in the third quarter of 2025, consensus calls for health care earnings to grow 12.1% year-over-year for calendar year 2025, putting it among the top three sectors and well ahead of the S&P 500 Index broadly. The health care sector’s revenue growth for 2025 is expected to be second only to technology.3

Favorable Demographic Trends. An aging population is expected to provide an accelerating and sustained structural growth tailwind for the health care sector. In the U.S., the Census Bureau projects nearly 21% of the population will be over 65 by 2030. In Europe, that number is 23%. Health care spending more than doubles for older individuals compared to other age groups,2 as the prevalence of chronic diseases increases. Overall health care expenditure is growing faster than GDP in many regions. In the U.S., health care spending grew 8.2% in 2024,5 outpacing GDP growth of 2.8%.6

Innovation Beneficiary. The rapid growth of artificial intelligence (AI) is transforming health care by improving diagnostic accuracy, streamlining administrative tasks, advancing data analytics, accelerating drug discovery and enhancing profitability. The expansion of digital health care, via telehealth visits and remote patient monitoring, is improving access to patient-centered physical and mental health care, enhancing efficiency and reducing costs. Revolutionary advances in genomics and GLP-1s are enabling more personalized and effective treatments. Game-changing innovations in medical devices, like surgical robotics and neural implants, offer powerful long-term growth prospects. PwC projects that by 2035, about $1 trillion in spending will shift from today’s high-overhead, fragmented, infrastructure-heavy delivery model toward AI-enabled, in-home, proactive, personalized care.7 

Strategic Alliances. Several of the “Magnificent Seven” companies driving U.S. equity market returns since 2023, including Alphabet, Microsoft and Amazon, have been forging alliances with health care companies, creating a crossover effect. Also, M&A activity, especially within the life sciences and pharmaceutical industries, picked up in 2025,8 driven by therapy and treatment innovations and demand for high quality, scalable businesses.

Diversified Growth Sub-Sectors. Within the health care sector, there is great opportunity for investment portfolio diversification, as each of a broad set of sub-sectors has its own risk/reward profile. For example, health care services and facilities, including hospitals and health insurance and managed care companies, can offer relative stability but may be affected by regulatory and policy changes. Biotechnology, pharmaceuticals and medical technology companies face regulatory scrutiny and are subject to the risk of clinical trial failures but may offer higher long-term growth potential given the rapid development and remarkable breakthroughs of new drugs and treatments and the creation of new markets.

1 “Sick as a Dog,” J.P. Morgan, August 12, 2025.      2“US Healthcare: Attractive Valuation for a Structural Growth Opportunity,” AllianceBernstein, May 2025.      3FactSet, October 3, 2025.  Forward p/e ratio measures a company’s share price relative to its projected future earnings per share.       4“Investing in Healthcare, The Overlooked Sector Poised for a Remarkable Comeback,” Alphacione, September 3, 2025 and “Investing in health care: What to consider,” J.P. Morgan Wealth Management, November 2024.      5CMS.gov, June 24, 2025.      6Bureau of Economic Analysis, January 30, 2025.     7 “From breaking point to breakthrough: the $1 trillion opportunity to reinvent healthcare,” PwC, September 17, 2025.     8 ”Healthcare M&A Mid-Year Insight,” Modern Healthcare, August 7, 2025.

Past performance is no guarantee of future results. Oak Associates Funds are available to U.S. investors only. The thoughts and opinions expressed in the article are solely those of the author as of October 15, 2025. The referenced indices are for illustrative general market comparisons only and not meant to represent performance of any fund. Investors cannot invest directly in an index.   

To determine if the Oak Associates Funds are an appropriate investment for you, carefully consider each Fund’s investment objectives, risk factors and charges and expenses before investing. This and other information can be found in the Funds’ prospectus, which may be obtained from your investment representative or by calling 888.462.5386. Please read it carefully before you invest or send money.

Mutual fund investing involves risk, including the possible loss of principal. Oak Associates Funds are distributed by Ultimus Fund Distributors, LLC (Member FINRA). Ultimus Fund Distributors, LLC and Oak Associates Funds are separate and unaffiliated.                           

20251021-4905700


More News & Insights

Important Dates for Final Distributions

Record Date:                                        12/26/2025

Ex-Dividend/Reinvestment Date:         12/29/2025

Payment Date:                                     12/30/2025

Important note: Investors will not experience a loss from a distribution. The per-share amount of a distribution is deducted from a fund’s net asset value (NAV). Fund prices will reflect a NAV reduction on the day that a distribution is paid

2025 CAPITAL GAINS & DIVIDEND DISTRIBUTIONS

Fund NameTickerShort Term Capital GainLong Term Capital GainIncomeTotal Distribution
White Oak Select Growth FundWOGSX$0.0000$11.8979$0.8117$12.7096
Pin Oak Equity FundPOGSX$0.0000$7.7210$0.2214$7.9424
Rock Oak Core Growth FundRCKSX$0.0000$1.2821$0.0000$1.2821
River Oak Discovery FundRIVSX$0.0000$0.0000$0.0564$0.0564
Red Oak Technology Select FundROGSX$0.0000$3.5513$0.0180$3.5693
Black Oak Technology FundBOGSX$0.0000$0.4695$0.0000$0.4695
Live Oak Health Sciences FundLOGSX$0.0000$0.4647$0.0232$0.4879

If you have any questions, please call Shareholder Services at 1-888-462-5386, Monday – Friday, 8:00 a.m. to 6:00 p.m. ET.

To determine if this fund is an appropriate investment for you, carefully consider the fund’s investment objectives, risk factors, charges and expenses before investing.  This and other information can be found in the fund’s prospectus, which may be obtained by calling 1-888-462-5386 or visiting our website at www.oakfunds.com.  Please read it carefully before investing.

Oak Associates Funds are distributed by Ultimus Fund Distributors, LLC. Ultimus Fund Distributors, LLC and Oak Associates Funds are separate and unaffiliated.


The performance data quoted represents past performance. Past performance does not guarantee future results. The investment return and principal value of an investment will fluctuate so that an Investor’s shares, when redeemed, may not be worth more or less than their original cost and current performance may be lower or higher than the performance quoted. For performance data current to the most recent month end, please call 1-888-462-5386.


More News & Insights

Read More

Seeing Through The Trees

Read More
Read More

2025 Year End Market Commentary & 2026 Outlook

Read More
Read More

Health Care Sector Clouds May Be Clearing

Read More

Beyond the Sand

The stock market is not the underlying economy.  While they are connected, their relative performance often diverges for a variety of reasons.  As it relates to the current quarter, US equities continue to look beyond the risk of tariffs, weakening unemployment data and the threat of inflation, in favor of the benefits that a Federal Reserve interest-rates-easing cycle could produce.   This does not suggest the market is ignoring the near-term risks, simply that it is more focused on the economic benefits which AI innovation might create, the capital spending surge it is fueling, and the stimulative lifeline a more accommodative Federal Reserve may enable. 

Year-to-date, the S&P 500 Index is up 14.8%, driven by large-cap technology stocks and telecommunication companies benefiting from AI capital spending.  For the third quarter of 2025, the broad market index rose 8.1%.  While tariffs have dominated the policy headlines under the new administration, the stock market has consistently rallied on news that tariffs will not be enacted to the degrees originally presented.  Put simply, avoiding the worst-case tariff outcomes has been applauded.

The on-again, off-again tariffs have, however, weighed on the US economy.  Reconfiguring the US supply chain will not happen overnight, and businesses are hesitant to upend operations with uncertainty over the lasting nature of any tariffs.  Food prices are creeping higher, and job growth has stalled.  Strain on the labor market has been building, and various data series have confirmed signs of stress.

In response to the changes in the labor market, in September 2025, the Federal Reserve lowered the short-term interbank lending rate by 25 bps and signaled the likelihood of further rate cuts.  After having battled pandemic-related inflation for several years, the Fed has determined that cracks in the labor market necessitate it shift its focus from inflation and to unwind the restrictive monetary environment in support of job growth.   The task confronting the Federal Reserve is precarious as tariff-induced inflation remains a real risk.  Threading the needle to support employment, while avoiding stagflation (rising prices and unemployment) will be difficult.

The chart above shows the slow climb in the civilian unemployment rate from a low of 3.4% in April 2024 to 4.3 % in August 2025 and underscores the Fed’s shift to thwart its progression.  Private employment data, as seen by the ADP Report, has also fallen three of the last four months, showing job losses and revisions indicating a bleaker assessment.

Federal Reserve Chairman Powell has proven to prefer a slow and methodical approach to changes in interest rate policy.  We expect this easing cycle to be no different, despite mounting pressure from the Trump administration, at least for now.  Further interest rate reductions are likely, but the pace of the decrease will depend upon whether the employment data deteriorates further.  Complicating the employment situation is a series of revisions to data questioning the veracity of the underlying job market.  Just last month, the Bureau of Labor Statistics revised 2024 job growth significantly, raising further concerns about the reliability of recent economic strength and weaker-than-expected job strength.  Certainly, the ambiguity around government spending, immigration raids, DOGE firings, and trade policy only add to the cloudy employment picture.

Thus far, US stocks continue to tolerate tariff sand being sprinkled into the gears of economic activity.  Market participants have become indifferent to the trade war threats, policy reversals, or uncertain legality of the import duties.  With the administration’s tariff policy initially being ruled unconstitutional through its use of the International Emergency Economic Powers Act (IEEPA), it appears the worst-case, or more destructive consequences, might be avoided.  The US Supreme Court is set to address the IEEPA issue in the near future, but even if the current tariff policy approach is curtailed, Congress and the Administration have other paths that achieve similar effects. 

Ultimately, only time will tell whether the decoupling from the global economy has lasting implications, or if the taxation that tariffs produce will dump too much sand in the economic engine of the US economy.  A tariff is a tax on domestic businesses that will either suffer lower margins or push higher prices onto consumers.  Tariffs have the secondary effect of acting as a brake on overall economic activity.  Any slowdown in economic velocity will create a drag on employment.  But until companies start reporting lower growth, falling margins, or inflation becomes more persistent, the frenzy around AI will remain.  Thus far, however, the current record high level of overall earnings (EPS) and profit margins is among the strongest evidence validating US stocks position at all-time highs. 

As of the writing of his commentary, Congress has been unable to agree on funding the government, and a shutdown is underway.  Equities prices don’t seem too concerned, but this could change.  For now, the default assumption is that both sides will need to compromise in order to keep the government open or that any closure will be temporary.  Prior government shutdowns, while inconvenient, had been largely ignored by long-term investors. 

Regardless of what happens in Washington, the market’s focus on AI and the potential economic benefits continue to drive the large-cap technology companies.  Given the outsized weight these stocks maintain in the market-cap weighted indexes, such as the S&P 500 and Nasdaq 100 indexes, their performance is carrying the market.  This cohort of large, highly profitable technology leaders are able to invest aggressively, independent of debt markets, and use their competitive advantages to solidify future opportunities.  It is an enviable approach.

At some point, the divergence between the US equity market and the economy will reconverge.  But predicting the timing of any reversion is difficult.  Afterall, stocks tend to be forward looking, while economic data is by nature backward looking.  With the economic benefits that AI might beckon and a more accommodative monetary policy forthcoming, it appears US stocks have so far tolerated less favorable economic data, though it is unclear how long the dynamic will persist.

Thanks for investing with Oak Associates.

Kind Regards,

Robert Stimpson, CFA
Chief Investment Officer
Oak Associates, ltd.

Grow stronger together.


The investments referenced in this article may or may not align with those currently recommended or held by Oak Associates for itself, its associated persons, or on behalf of clients within the firm’s strategies as of the date indicated. These investments are subject to change. The mentioned investments do not necessarily represent all those bought, sold, or recommended to advisory clients over the past twelve months. Portfolios in other Oak Associates strategies may contain the same or different investments, due to factors such as varying investment strategies, client-specific restrictions, mandates, substitutions, liquidity requirements, or legacy holdings, among others. The investments highlighted were not selected based on their past performance. Readers should not assume these investments have been or will be profitable in the future.


Past performance is not a reliable indicator of future results. Investments can lose value, and there is no guarantee that any strategy or product will achieve its objectives or perform as anticipated. All investments involve risk, including the potential loss of principal. Before making any investment decisions, individuals should assess their risk tolerance and seek advice from a financial advisor. Information that is sourced from a third-party is assumed to be accurate but is not guaranteed. This commentary does not constitute an offer or solicitation to buy or sell any financial products.


The S&P 500 Index is a well-known, market-capitalization-weighted index of 500 widely held U.S. equities, designed to reflect broad U.S. stock market performance.


CFA is a registered trademark of the CFA Institute.


More News & Insights

Read more: 2025 Third Quarter Market Commentary

AI Enablers

AI Enablers span across multiple industries and can be categorized into physical and non-physical components. The physical side includes tangible infrastructure critical for the AI revolution to advance. For instance, data must be stored and transmitted efficiently, and enormous amounts of energy must be delivered consistently. This necessitates robust physical infrastructure, which includes data centers, telecom towers, and the power grid.

Within physical infrastructure, power generation plays a crucial role. AI technologies demand vast and continuous power, particularly for operating data centers. Unfortunately, due to decades of underinvestment, the U.S. may be ill-equipped to meet this growing demand. Companies in this space are categorized into power equipment providers such as those producing turbines, generators, and renewables, and energy storage firms that supply batteries and fuel tanks to ensure uninterrupted energy availability.

Meeting rising power demands requires a robust electric infrastructure capable of swiftly integrating new power capacity to prevent bottlenecks. These power outages are associated with the increase in natural disasters and an antiquated grid1. As the infrastructure ages, the resilience to extreme weather diminishes. The ironic part is, there has been an increase in wildfires (natural disasters) because the grid is outdated. Companies associated with electrical infrastructure are involved in power transmission & distribution, and electrical equipment.

AI also relies heavily on advanced IT infrastructure to process and analyze massive volumes of data. This includes networking equipment, cooling systems, servers and hardware, and semiconductors.

In addition to physical assets, non-physical infrastructure forms a vital part of the AI ecosystem. These intangible components are foundational for development and deployment. Categories include software, services, data, cloud platforms, algorithms, and human talent.

AI Adopters

While AI Enablers construct the foundation, AI Adopters are the firms applying AI technologies to achieve business outcomes. These adopters typically fall into two categories: product innovation and operational optimization. Product innovation involves enhancing customer-facing products and services using AI. This can be achieved through new product development, such as AI-powered drug discovery, autonomous vehicles, robotics, or consumer trend forecasting. It can also include product enhancement, like AI chatbots for customer support, improved content recommendations in social media and streaming services, and advanced cybersecurity tools for threat detection. However, some adopters can fall into both categories.


On the other hand, optimization focuses on internal workflows and operational efficiency. Companies use AI to improve inventory management by predicting demand, optimizing stock levels, and reducing the likelihood of overstocking or understocking. In supply chain management, AI reduces delays, enhances efficiency, and cuts costs. Automation through robotics and software will further increase productivity, allowing businesses to operate around the clock with greater efficiency and reduced labor expenses.


The divide between AI Enablers, who build and sustain this ecosystem, and AI Adopters, who apply it for innovation and efficiency, highlights the symbiotic relationship driving this technological evolution. Physical components such as power generation, electric infrastructure, and IT systems are indispensable for supporting AI’s intense computational and energy demands. At the same time, non-physical assets like software, algorithms, and talent fuel the creative and operational applications of AI across industries.


The adoption of artificial intelligence is no longer a strategic advantage, it is rapidly becoming a business imperative. Organizations that successfully integrate AI into their products and operations are not only improving efficiency but also creating more intelligent, adaptive, and personalized experiences for their customers. As AI continues to evolve, the momentum behind its adoption must be supported by robust investments in both infrastructure and talent development. The long-term viability of AI will hinge on how effectively we build out the physical and digital foundations that support it, while also fostering a skilled workforce capable of driving innovation. The question is no longer whether AI will transform industries, but rather how prepared we are to support and guide that transformation. In the remainder of the Beyond AI series, we will explore how specific industries are engaging with AI whether as enablers building the foundation, adopters leveraging its capabilities, or both and examine the potential investment opportunities within each space.

1https://www.ibtimes.com/aging-us-power-grid-blacks-out-more-any-other-developed-nation-1631086

20250730–4602725

Uncertainty 2.0: Resilience Amid Evolving Challenges

The US equity markets have shown remarkable resilience in 2025 despite the ongoing turbulence. After a first quarter decline of 4% in the S&P 500 Index, the second quarter delivered a robust 10.6% rebound, reaching a new all-time high. However, the journey was far from smooth: from mid-February peaks to early April lows, the market endured a nearly 19% drop, driven by concerns over initial tariff proposals and escalating trade tensions, as noted in our first quarter commentary ‘The Only Certainty is Uncertainty’.

Since April, the market has surged more than 24%, bolstered by progress in trade negotiations that eased fears of worst-case scenarios. Yet, new uncertainties loom, including a critical tariff deadline in July, the approval process for the proposed budget bill, and rising geopolitical tensions in the Middle East. Volatility has risen and is likely to persist as investors navigate these evolving challenges in the second half of 2025.

Despite these headwinds, both the economy and equity markets have demonstrated strength, with emerging tailwinds offering promise. The recent rally has been fueled by improved clarity stemming from easing trade tensions with China, a pause in reciprocal tariffs, and corporate earnings that have surpassed expectations. Although sector performance has remained uneven, investor sentiment has improved in response. Technology stocks staged a strong comeback in the second quarter after lagging in the first three months of the year, while traditionally defensive sectors—such as Healthcare and Consumer Staples—underperformed on a relative basis.

Recession concerns have eased as severe trade policy scenarios appear increasingly unlikely. However, economic data may remain volatile as the inventory build-up triggered by early-year tariff anticipation continues to cycle through the system. Housing affordability remains a headwind to growth, pressured by both elevated mortgage rates and home prices. A lesser-discussed potential catalyst, however, is the proposed budget bill’s provision for immediate expensing of capital investments, which could significantly boost corporate spending, driving economic growth, job creation, and consumer activity.

A robust labor market and steady wage growth have continued to underpin consumer spending and overall economic expansion. However, momentum has slowed as consumers have exercised greater caution amid ongoing tariff-related uncertainty. While tariffs typically represent a one-time price adjustment rather than persistent inflation, they come at a particularly challenging time—layered on top of several years of elevated price pressures that have already strained household budgets, especially for lower-income families. The chart below, which we have referenced previously, helps illustrate this dynamic.

Source: Strategas, BLS, Haver

In an effort to explain the disconnect between a healthy labor market and declining consumer confidence, the economic research firm Strategas developed the “Common Man CPI.” This alternative inflation measure breaks out spending on essentials—such as food and energy—from discretionary items like dining out and jewelry. As shown in the chart, while wages (red line) have indeed increased, they have not kept pace with the rising costs (blue line) of day-to-day necessities. This divergence may help explain why consumers remain uneasy, particularly with the potential implications of tariffs still on the horizon.

While the post-Covid surge in prices persists, annual inflation has remained modest, hovering just above the Federal Reserve’s 2% target level. The ‘rents’ component, a lagging indicator of housing costs, has taken longer to adjust but continues to exert downward pressure on overall inflation. Lower energy prices have also played a significant role in keeping inflation in check. After a brief spike following Israel’s initial strikes against Iran, the recent cease-fire has brought prices back down. In the near-term, geopolitical developments and the outcomes of tariff negotiations are likely to be the primary drivers of inflation trends.

Thus far, the economy and financial markets have adapted to evolving uncertainties with notable resilience. Although economic and earnings growth has moderated, both remain in positive territory. Tariff-related disruptions are expected to exert some influence but appear well-contained relative to early worst-case projections. Many of the prevailing uncertainties are now well understood, with increased clarity anticipated in the months to come.

Looking further out, structural tailwinds offer reasons for optimism. Business investment in artificial intelligence was already supporting capital expenditures, and the provision for immediate expensing of manufacturing structures, software, new equipment, and R&D investments—currently included in the proposed budget—would further incentivize corporate spending. Increased investment lays the groundwork for stronger GDP performance and productivity gains. A stronger economy supports employment and consumer spending, creating a favorable environment for earnings growth and equity markets.

Finally, please visit our new website at WWW.OAKFUNDS.COM. As always, thank you for reading and please do not hesitate to reach out to us if we can assist you with achieving your investment goals in any way.

Kind Regards,

Jeff Travis, CFA
Portfolio Manager
Oak Associates, ltd.


To determine if the Oak Associates Funds are an appropriate investment for you, carefully consider each Fund’s investment objectives, risk factors, and charges and expenses before investing. This and other information can be found in the Fund’s prospectus, which may be obtained from your investment representative or by calling 888.462.5386. Please read it carefully before you invest or send money.

 IMPORTANT INFORMATION

The statements and opinions expressed are those of the author and do not represent the opinions of Oak Associates or Ultimus Fund Distributors, LLC. All information is historical and not indicative of future results and is subject to change. Readers should not assume that an investment in the securities mentioned was profitable or would be profitable in the future. This information is not a recommendation to buy or sell. This manager commentary represents an assessment of the market environment at a specific point in time and is not intended to be a forecast of future events or a guarantee of future results. This information should not be relied upon by the reader as research or investment advice.

Past performance is no guarantee of future results. Investments are subject to market fluctuations, and a fund’s share price can fall because of weakness in the broad market, a particular industry, or a specific holding. The investment return and principal value of an investment will fluctuate so that an Investor’s shares, when redeemed, may be worth more or less than their original cost and current performance may be lower or higher than the performance quoted. Click here for standardized performance.

The S&P 500 Index is a commonly-recognized, market capitalization-weighted index of 500 widely held equity securities, designed to measure broad U.S. equity performance. One cannot invest directly in an index.

CFA is a registered trademark of the CFA Institute.

Oak Associates Funds are distributed by Ultimus Funds Distributors, LLC (Member FINRA). Ultimus Fund Distributors, LLC and Oak Associates Funds are separate and unaffiliated.


More News & Insights

Read More

2025 First Quarter Market Commentary

Read More
Read More

Beyond AI – Part 1

Read More
Read More

Our Website Has a New Look

Read More